Energy Awareness Course
Use CureZone kode to get a free session!
Lugol’s Iodine Free S&H
J.Crow’s® Lugol’s Iodine Solution. Restore lost reserves.
Original Dr. Hulda Clark
Hulda Clark Cleanses
Energy Awareness Course
Use CureZone kode to get a free session!
Lugol’s Iodine Free S&H
J.Crow’s® Lugol’s Iodine Solution. Restore lost reserves.
Original Dr. Hulda Clark
Hulda Clark Cleanses
Its sad to see an ideologue crack up.......
Blaming everything on some entitlement programs is
the last gasp of the right winger fixated/indoctrinated
in the left/right paradigm. Its kind of like delirium tremors. Left/right left/right keep marching to that beat,
and you will never see your elite rich masters and that
is what they want.
Amerika has been turned into a corporatacracy
with all government agencies in collusion with the corporations. O is no different than Bush, he hasnt closed
one military base.
How about the war on drugs for the last 75 years-2 Trillion wasted.
The prison industrial complex another trillion for the last
75 years wasted.
Military industrial complex- probably 10 or 20 trillion or more including vietnam and iraq, afghan,,800+ bases.
Bailouts for the rich banksters-Trillions Bush/O
Half of welfare spending is on healthcare, which should simply be a right. So welfare minus healthcare is 225 billion vs us budget of what 3 trillions?
The Heritage foundation has some info (it's dated though).
Keep in mind this is a very right-wing organization with an anti-welfare agenda, but I don't know if they are too far off.
http://www.heritage.org/Research/welfare…
Based on their estimates, Federal spending on Food, Cash, and Housing programs would be about $174 billion in 2006.
Total spending on all means-tested programs would be about $450 billion but that includes medicaid, education programs, etc. and things that you don't typically consider welfare. In fact over half of "welfare" spending in the US is on healthcare.
Usually people think welfare means "a cheque from the government to poor people" so that would be significantly less than $174 billion, since that includes public housing and food stamps
3 years ago
|
||||||||||||||
|
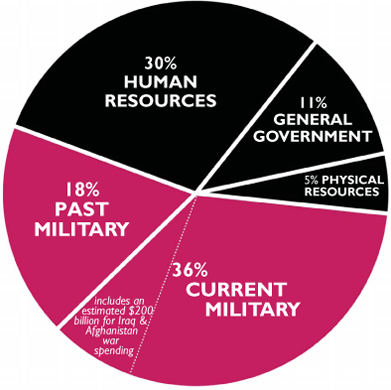
Current Military
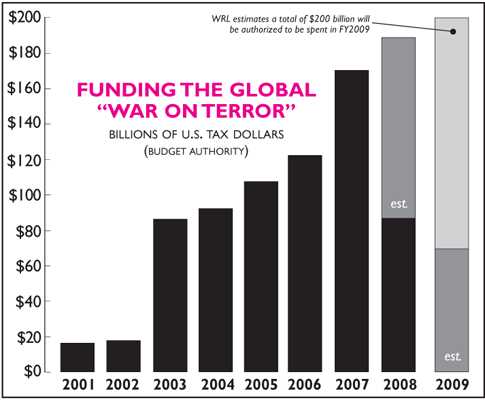
$965 billion: • Military Personnel $129 billion • Operation & Maint. $241 billion • Procurement $143 billion • Research & Dev. $79 billion • Construction $15 billion • Family Housing $3 billion • DoD misc. $4 billion • Retired Pay $70 billion • DoE nuclear weapons $17 billion • NASA (50%) $9 billion • International Security $9 billion • Homeland Secur. (military) $35 billion • State Dept. (partial) $6 billion • other military (non-DoD) $5 billion • “Global War on Terror” $200 billion [We added $162 billion to the last item to supplement the Budget’s grossly underestimated $38 billion in “allowances” to be spent in 2009 for the “War on Terror,” which includes the wars in Iraq and Afghanistan] Past Military,
$484 billion: • Veterans’ Benefits $94 billion • Interest on national debt (80%) created by military spending, $390 billion Human Resources
$789 billion: • Health/Human Services • Soc. Sec. Administration • Education Dept. • Food/Nutrition programs • Housing & Urban Dev. • Labor Dept. • other human resources. General Government
$304 billion: • Interest on debt (20%) • Treasury • Government personnel • Justice Dept. • State Dept. • Homeland Security (15%) • International Affairs • NASA (50%) • Judicial • Legislative • other general govt. Physical Resources
$117 billion: • Agriculture • Interior • Transportation • Homeland Security (15%) • HUD • Commerce • Energy (non-military) • Environmental Protection • Nat. Science Fdtn. • Army Corps Engineers • Fed. Comm. Commission • other physical resources |
 Total Outlays (Federal Funds): $2,650 billion
MILITARY: 54% and $1,449 billion NON-MILITARY: 46% and $1,210 billion  HOW THESE FIGURES WERE DETERMINED
These figures are from an analysis of detailed tables in the “Analytical Perspectives” book of the Budget of the United States Government, Fiscal Year 2009. The figures are federal funds, which do not include trust funds — such as Social Security — that are raised and spent separately from income taxes. What you pay (or don’t pay) by April 15, 2008, goes to the federal funds portion of the budget. The government practice of combining trust and federal funds began during the Vietnam War, thus making the human needs portion of the budget seem larger and the military portion smaller.
*Analysts differ on how much of the debt stems from the military; other groups estimate 50% to 60%. We use 80% because we believe if there had been no military spending most (if not all) of the national debt would have been eliminated. For further explanation, please see box at bottom of page.
|
|||||||||||||
|
||||||||||||||
This Forum message belongs to a larger discussion thread. See the complete thread below. You can reply to this message!
-
Expand this whole thread (5 messages)
WWIII- Analysis of Financial Terrorism in America: #112153
13 y
5,451
-
Poor baby....Go ahead a cry your dumb ass off. You...
InCharge
13 y
4,951
-
Its sad to see an ideologue crack up.......
 #112153
13 y
5,078
This is the position of the above message within the thread.
- Re: WWIII- Analysis of Financial Terrorism in Amer... #143327 13 y 5,042
-
Its sad to see an ideologue crack up.......
-
Poor baby....Go ahead a cry your dumb ass off. You...
InCharge
13 y
4,951
CureZone Newsletter is distributed in partnership with https://www.netatlantic.com
Contact Us - Advertise - Stats
0.110 sec, (7)


