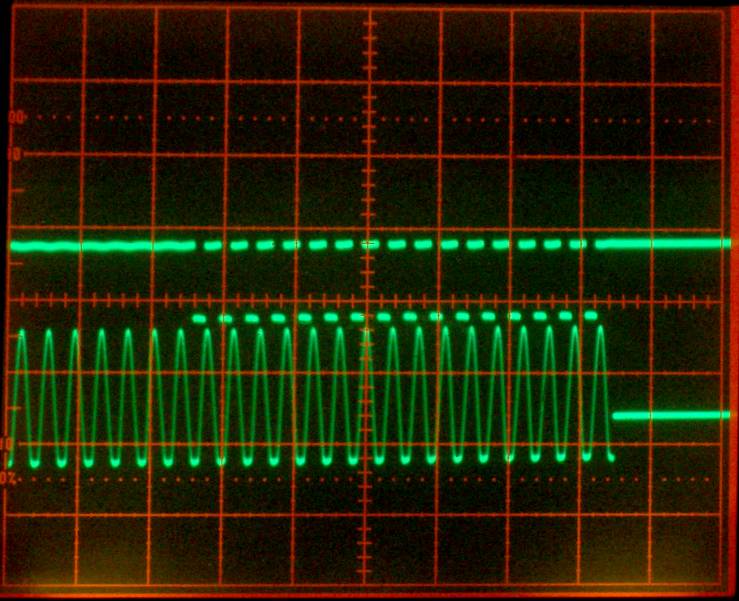
Scope image of F-Scan2 sampling signal at 1360Hz
The top trace is the sampling signal for the ADC in the F-Scan2 (scope channel connected to the RESET pin on the ADC). Below is the end of the F-Scan2 frequency burst signal as measured from the F-Scan2 output. The horizontal deflection is 2 ms/div.
You can see that those two frequencies match - this causes the F-Scan2 to give spurious peaks during a DIRP scan. This repeats at multiples of this frequency, so at 2720 Hz, 5080 Hz,.., and so on.
Recording a signal which frequencies larger than half of the sampling frequency (or Nyquest frequency) causes 'aliasing'. Here the F-Scan2 samples the signal from the finger probe 16 times (the 16 peaks on the upper trace) and probably averages over them for noise reduction. It compares these averaged ADC values of two consecutive frequencies and displays the difference on the screen. If the phase of the first signal just happens to record 16 times the upper peak and on the next scan 16 times the bottom peak of the 1360 Hz signal, then it will show a strong peak in the DIRP display.
URL:
Thumbnail:
Uploaded by Stephan2
